
 指标发布
指标发布|
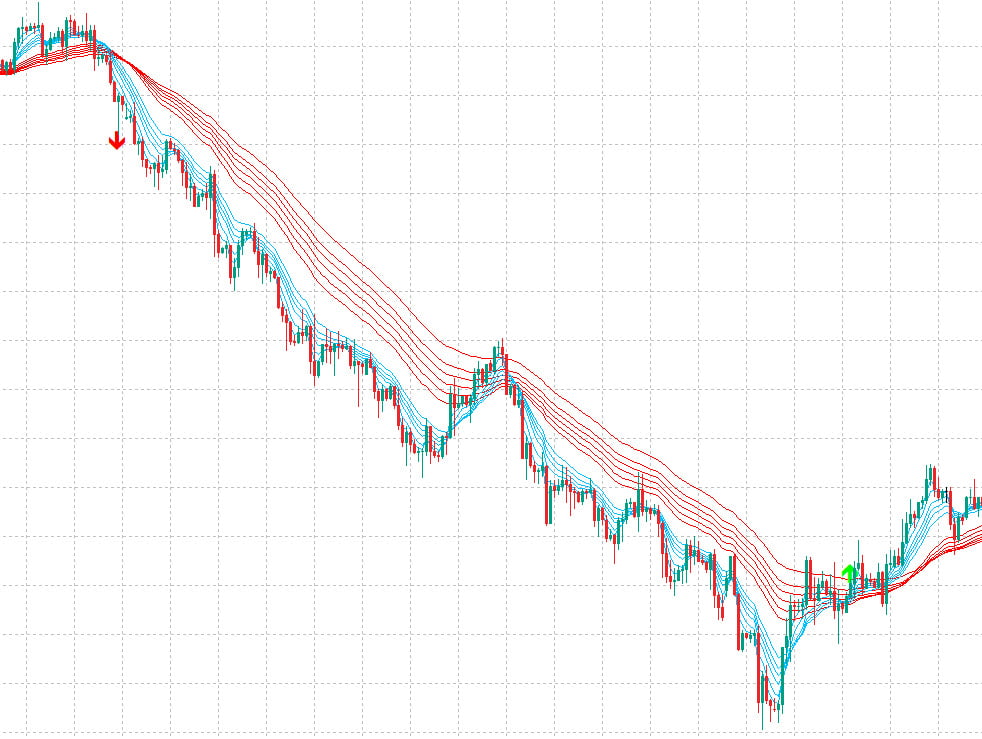
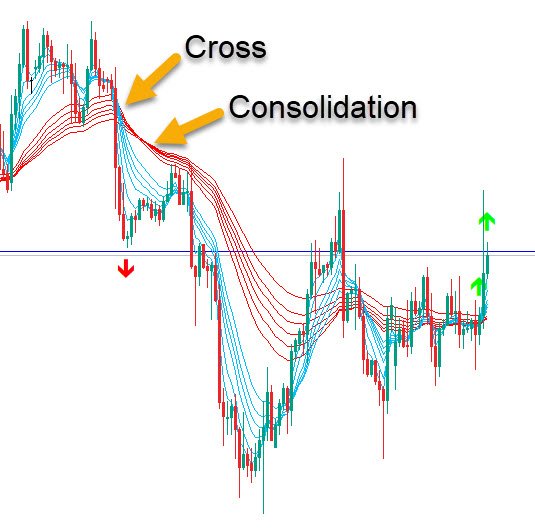
长期复合(30,35岁,40岁,45岁,50和60)投资者的行为有一个长期的方法一个给定的市场。 短期内复合代表交易商(3、5、8、10、12和18)试图获取短期利润。 [backcolor=rgb(241, 240, 175) !important]你可以看到在下面的图中,蓝线是短期教育津贴和红线是长期的。 有了这个系统,你将买当所有的短期复合交叉上面所有的长期复合,并出售短期复合交叉低于长期mtv大奖。 [backcolor=rgb(241, 240, 175) !important]如果两组相互压缩,或交错,这表明价格停顿了一下,价格趋势逆转是可能的。 通常短期线交叉长期的和长期的巩固和靠近。 意义的变化趋势是明年。 整合后有时价格拉回到长期复合然后方向新趋势。 基本上,经过交叉等合并,然后等待可能掉头,然后当你确定一个新的趋势开始,然后开始交易。 这个指示器显示箭头在下一栏,毕竟短期复合交叉长期的。 [backcolor=rgb(241, 240, 175) !important] 它只能在热门市场。 在等市场,复合经常将纵横交错,没有真正的趋势。 所以,只有贸易贸易额的时候是足够高的。 [backcolor=rgb(241, 240, 175) !important] 也使用这种支持/阻力和TDI指示器显示你进行交易的最佳时机。 所有这些额外的指标在下载如下: GMMA: Guppy Arrows Indicator[size=0.875em]BY ABIR · PUBLISHED MAY 22, 2019 · UPDATED MAY 23, 2019 [size=1.125em]This indicator uses the Guppy Multiple Moving Average Trading method to alert you of a possible coming trend. What is a ‘Guppy Multiple Moving Average (GMMA)’?GMMA attempts to identify trends by combining two groups of moving averages with differing time periods: The long-term EMAs (30, 35, 40, 45, 50, and 60) the behaviors of investors that have taken a long-term approach to a given market. The short-term EMAs represent traders (3, 5, 8, 10, 12, and 18) who are attempting to capture short-term profits. As you can see in the diagram below, blue lines are the short-term EMAs and red lines are long-term. With this system, you would buy when all of the short-term EMAs cross above all of the long-term EMAs, and sell when the short term EMAs cross below the long-term EMAs. If both groups become compressed with each other, or crisscross, it indicates the price has paused and a price trend reversal is possible. Usually the short-term lines cross the long-term ones and then the long-term ones consolidate and get closer. Meaning change in trend is coming next. After the consolidation sometimes price pulls back towards the long-term EMAs and then goes in the new trend direction. So basically, after cross wait for consolidation and then wait for a possible swing back and then when you are sure a new trend is starting, then start a trade. This indicator shows arrows in the next bar, right after all short-term EMAs cross the long-term ones. It works only in trending markets. In ranging markets, EMAs will criss-cross often and have no real trend. So, only trade it when trade volumes are high enough. Also use this with Support/Resistance and TDI indicator to show you the best time to place a trade. All these additional indicators are in the download below: |

009_GMMA_Arrows_Indicator_v1.0_Abiroid.com_.rar 售价: 2 枚金币(一共需要4金币)
